Sports statistics are an extremely important part of successful betting. Bookmakers’ coordinators rely on statistics to set odds, and they form a key informational component for every successful bettor. The question is who has the most information and the skill to process it: the bookie’s staff or the player. If the advantage lies with the player, then betting will be successful.
An analytical mindset is something you can’t teach, but if you have it, you just need the right statistical services. Today, we’re discussing one of the most popular ones — Livesport. I think many have seen similar projects under different names:
- MyScore.
- FlashScore.
- SoccerStand and others.
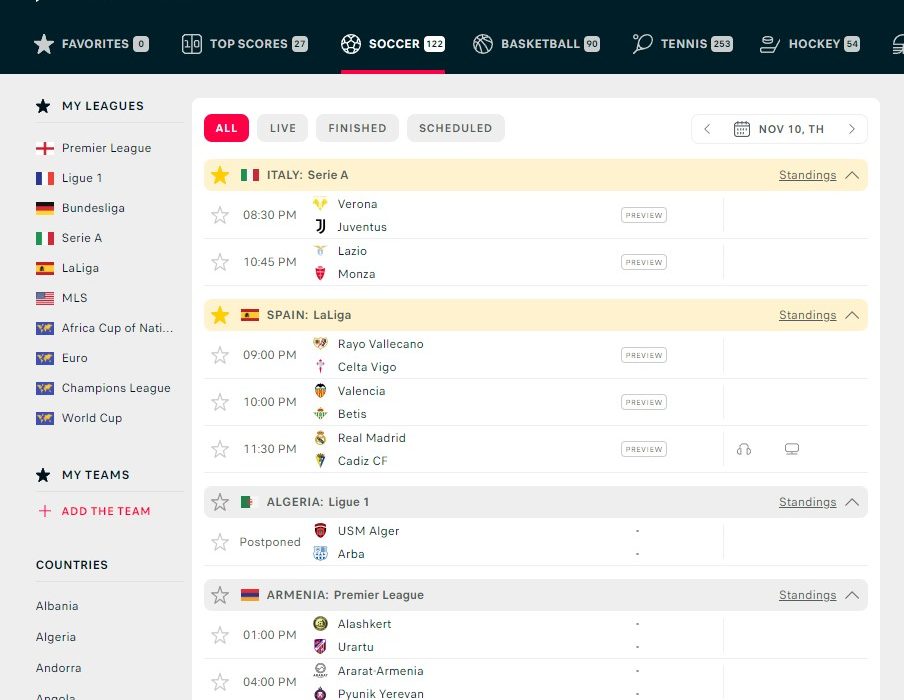
For those encountering the service for the first time, here’s what it looks like:
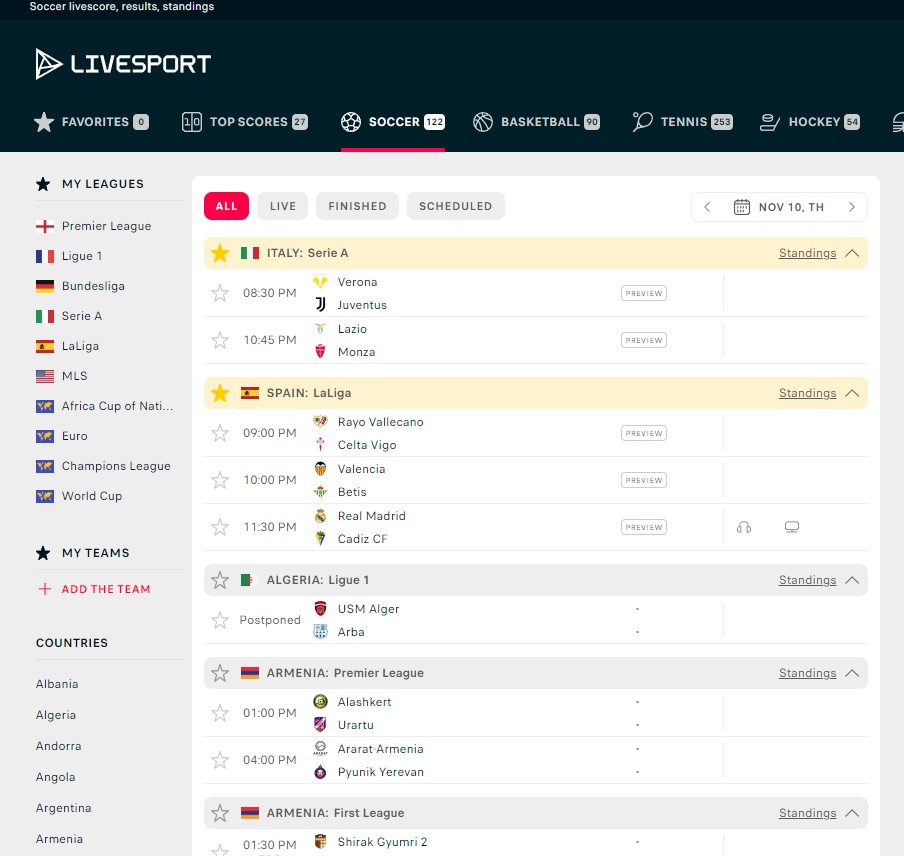
As you can see, the site offers not only statistics but also live match results, plus a brief description of what’s happening in the game: yellow cards, ejections in hockey, disallowed goals after video reviews, and so on. In general, let’s break down what we have here.
We’ll review it in three stages:
- Information section.
- Functionality.
- Statistics.
Information Section
Sports Types
Pay attention to the number of sports available.
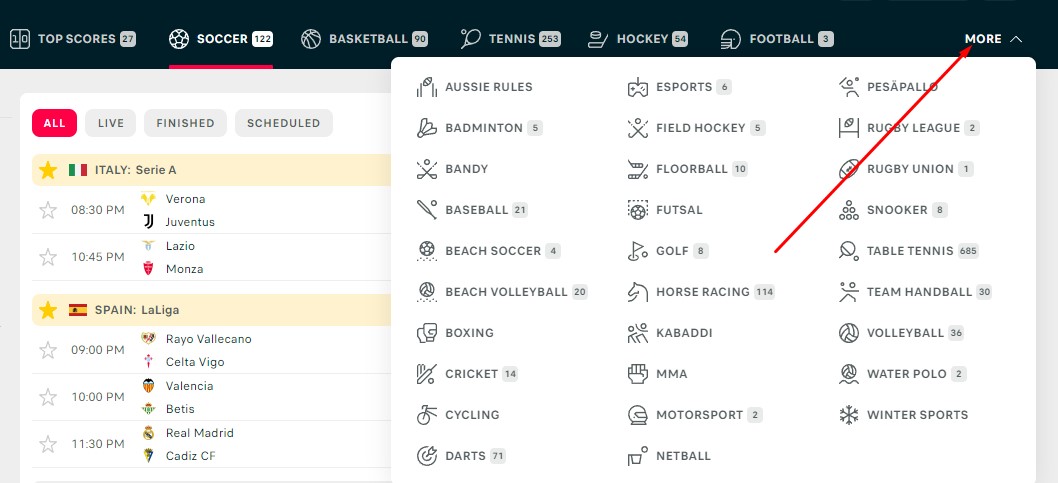
The main menu features the most popular sports, and hovering over ‘More’ reveals another 30 or so sports. Only a few might have a ‘TKR’ note next to matches, meaning the service will show only the final result, without live updates.
Each sport includes dozens, and sometimes hundreds, of various championships. It’s hard to imagine a bettor interested in a sport or tournament that isn’t available on LiveSport.
Tournaments
For ease of use, let’s switch to the Russian version of the site and see what tournaments are offered.
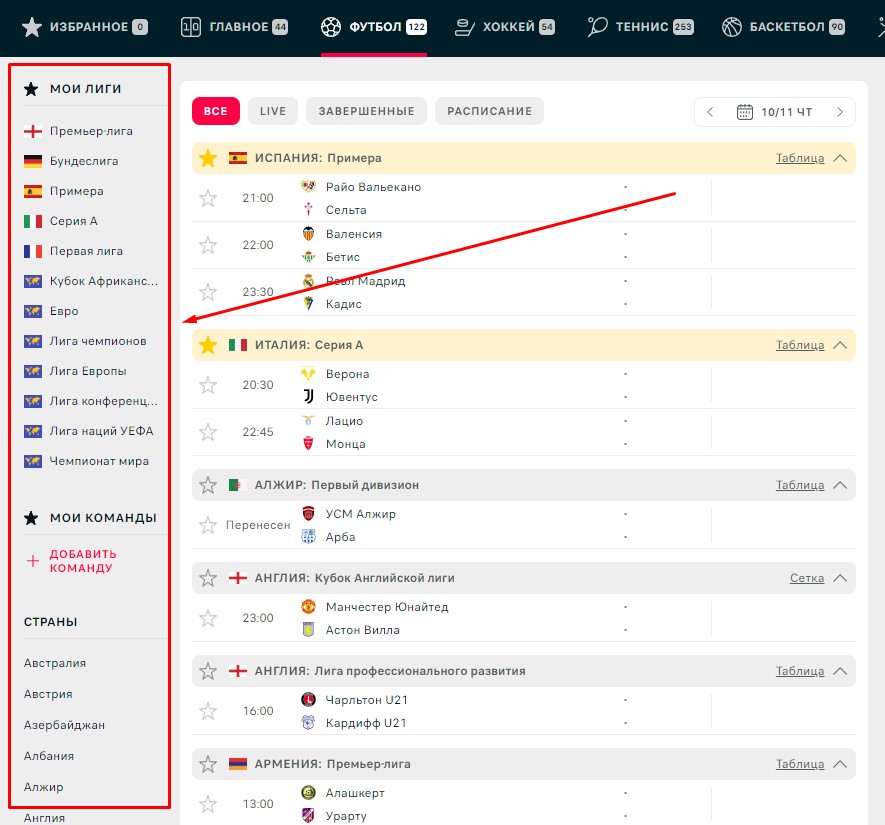
On the left, the main tournaments are listed. The site starts by suggesting the most popular ones. However, many users prefer to customize everything to their needs, adding or removing championships. This is straightforward, but we’ll cover it later when discussing functionality.
Note that below the main tournaments, there’s a breakdown by countries. Let’s open Australia, for example.
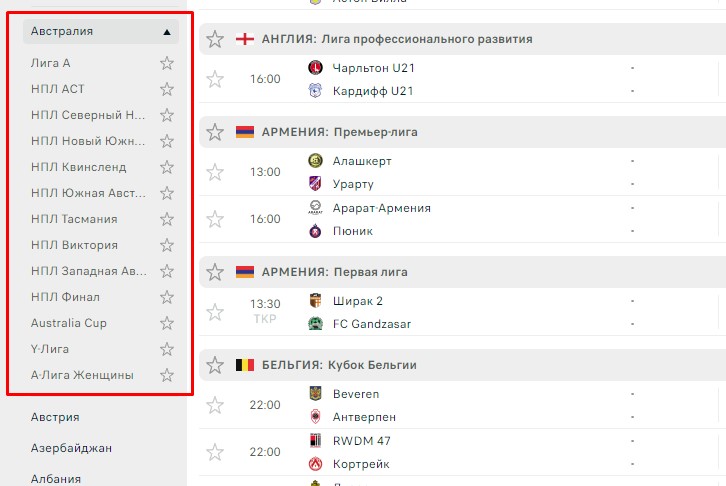
I doubt anyone expected Australia to have so many leagues, but they’re all here. So, there are truly too many tournaments and matches.
Functionality
Now, let’s figure out how to customize the site for yourself and use it more effectively.
Login
I understand that registering and logging in on a stats service might not appeal to everyone, but let’s face it: this site is excellent and becomes every bettor’s go-to tool. So, trust me, you’ll stick with it seriously and for the long haul, making registration worthwhile. At least to tailor the site to your needs and get information as quickly as possible.
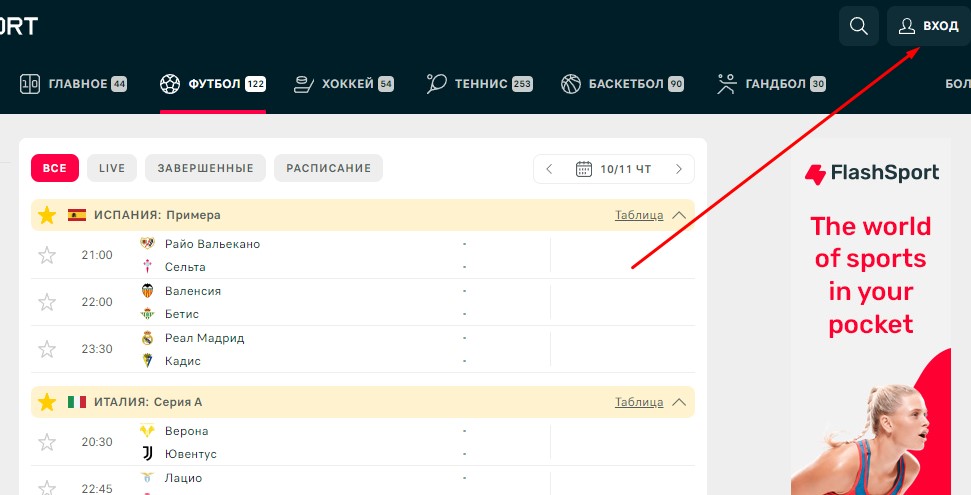
The button is in the top right corner. Conveniently, you don’t need to go through a full registration; you can log in via Google or Facebook accounts. On similar projects with different domains, other login options might be available. Just to the right of the login button is the settings button, where you can set your time zone, enable notifications for goals and match ends, and more. That’s also where my favorite feature is — the option for a dark theme! We’ll show the rest in dark mode from now on 🙂
Search
We already showed the search button in the previous screenshot. It’s not just a basic search like on Google or most sites. Let’s try finding something, like Daniil Medvedev, to check his status.
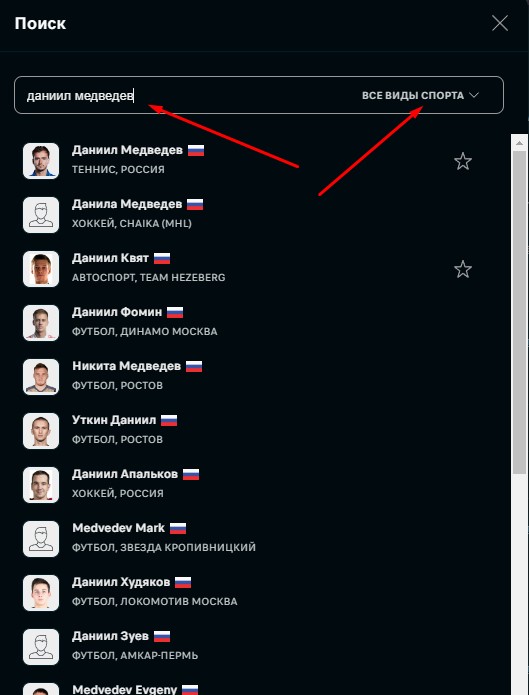
It found not only the tennis player but also a hockey player from the MHL. This highlights the extensive database. Due to the volume of information, search results might include a lot of irrelevant items, so use the ‘All Sports’ button to filter by the sport you need. Then, just click on the player or team to view their statistics.
Adding Matches to Favorites
To avoid tracking every match in a specific sport or jumping between tabs like ‘Soccer’ and ‘Hockey’, add matches to favorites. It’s simple!
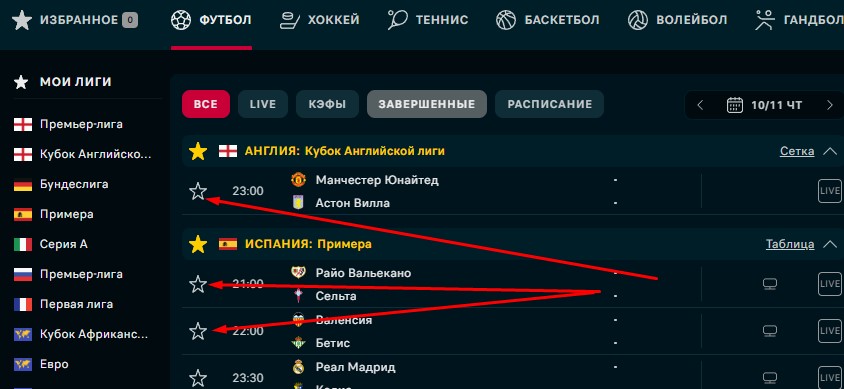
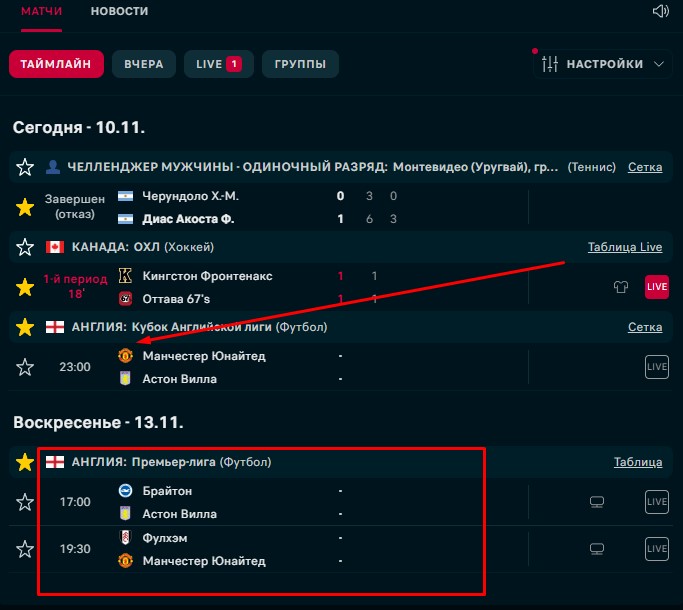
Just click the star next to the match, and it’s automatically added to favorites. For example, this way we select the ‘Manchester’ vs. ‘Aston Villa’ match, and do the same for a few hockey and tennis matches, resulting in this view.
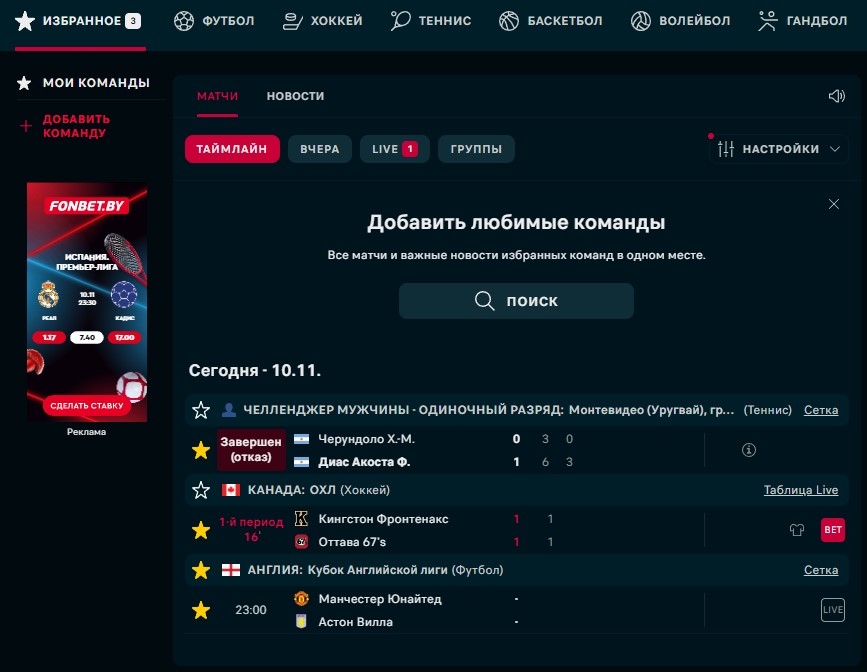
Here’s how it looks. I deliberately added matches in three statuses: completed, ongoing, and upcoming, for a more accurate picture. It’s best to add all matches you’re betting on to favorites and track them all at once.
Adding Teams to Favorites
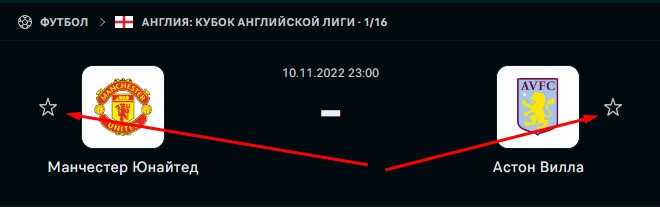
I know some readers are die-hard fans of specific teams. It’s all set up for them too. For example, let’s open the Manchester United vs. Aston Villa match (by clicking on it) and add both teams to ‘Favorites’.
I did that and also removed this match from ‘Favorites’ (if you remember, we added it for previous screenshots). Now, the ‘Favorites’ tab looks like this.
As you can see, the Manchester United vs. Aston Villa match is still there, and it will show upcoming matches for the teams we’ve selected. You’ll never miss a game for your favorite club. True fans might not miss anything anyway, but this prevents overlooking cup or friendly matches.
Adding Tournaments to My Leagues
You can do something similar with leagues as with teams. But you can go a step further and ensure your favorite tournament always appears at the top, alongside the top championships. It’s very simple. For example, if you always bet on the Austrian Championship and want it displayed at the top, do the following:
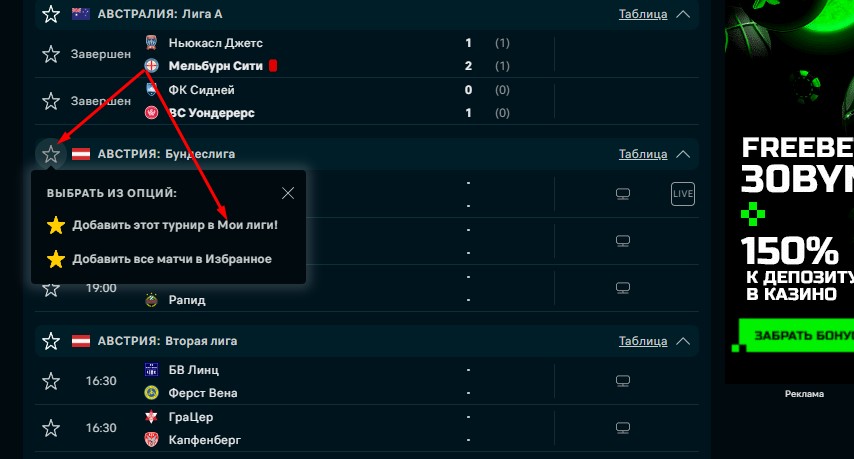
Just two simple steps: click the star and then ‘Add this tournament to My Leagues!’. Now it’s at the top. You can similarly remove tournaments you want to ignore, like the German Championship, from the top.
Statistics
Now, let’s get to the main part and examine the statistical data the site provides.
Statistics Within a Championship
Let’s open the Premier League, for example, by clicking the tournament name in the match list or via search. Here’s what we see.
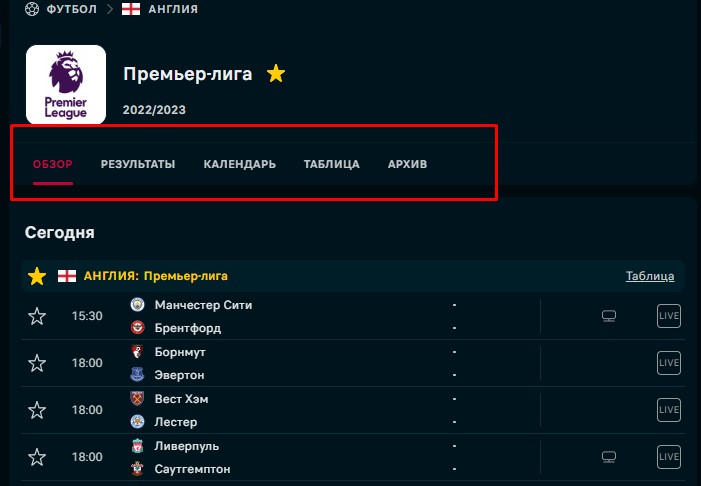
At the bottom of the screenshot are the upcoming matches, also found in the ‘Calendar’ menu. In the ‘Results’ tab, you can view all tournament results, including past years. Now, let’s check the next tab — ‘Table’.
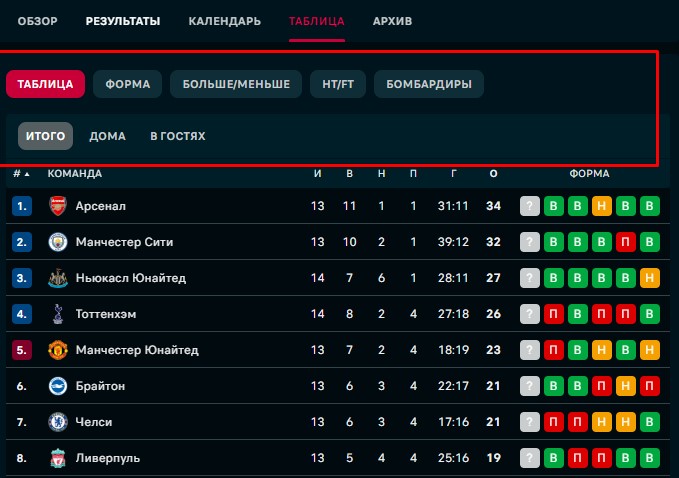
Initially, we see the league table: number of games, wins, draws, losses, goals scored and conceded, and points. Further along, it shows how teams have performed in their recent matches. For example, Arsenal has 2 wins, a draw, and another 2 wins in their last 5 games.
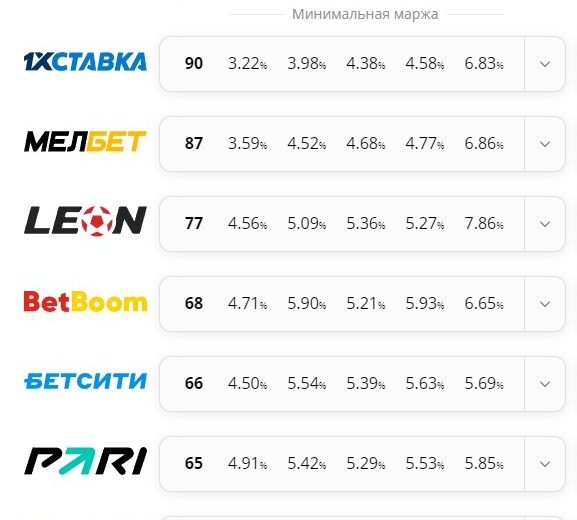
In the red box, I’ve highlighted extra features that can be very useful. The ‘Form’ tab shows the league table based on the last 5 matches, giving a clear picture of a team’s current form. The ‘Over/Under’ tab provides key stats on totals, where you can select any value like 1.5, 3.5, etc. The ‘HT/FT’ tab shows how teams perform before and after halftime, crucial for bets like ‘Half-Time/Full-Time’. In the ‘Top Scorers’ tab, you can see who scores the most and draw conclusions from that.
Note that for all these stats, you can further filter by ‘Home’ and ‘Away’ to view performance on home and away grounds.
Match Statistics
Let’s open a completed match and see what’s available. Let’s take a Bundesliga game between the two Borussias.
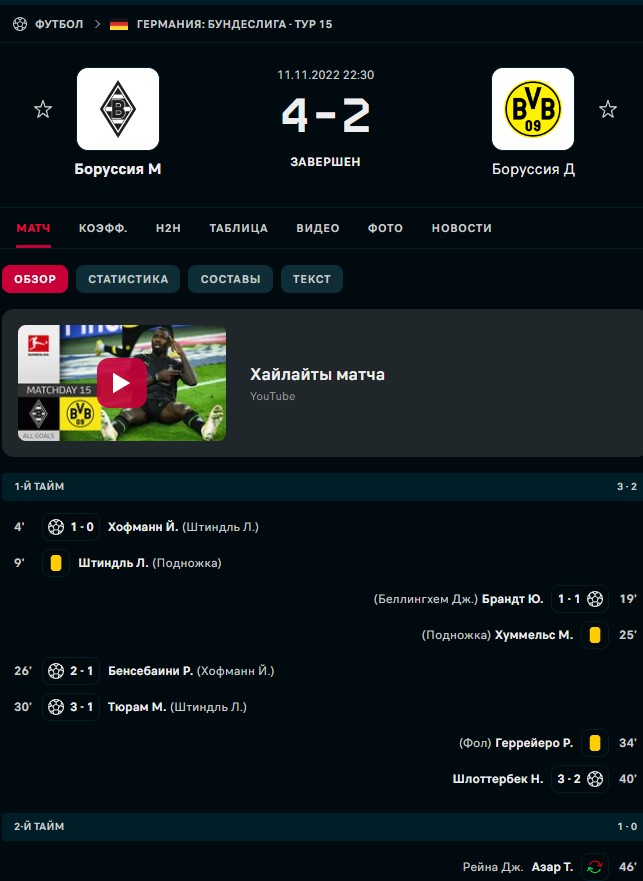
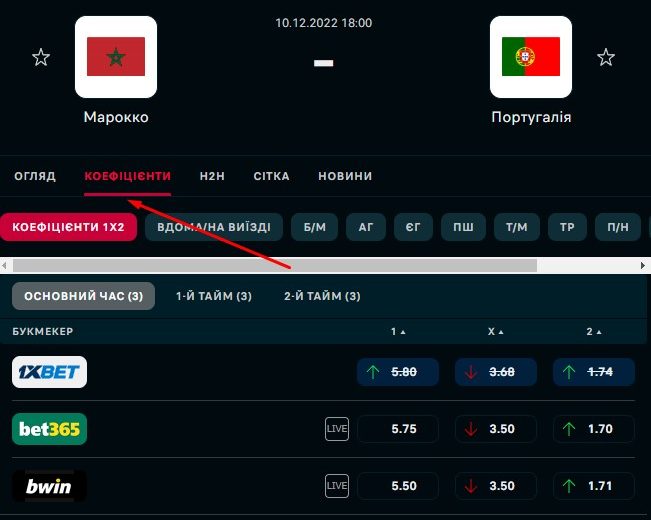
At the top, there are tabs to monitor pre-match odds, recent games, the table, plus photo and video reports. We’re currently in the ‘Overview’ tab. Here, we see cards, goals, and assist points. It also displays missed penalties, ejections, and disallowed goals via VAR.
Let’s open the ‘Statistics’ tab.

Here we have the full statistical breakdown. It’s available in live mode too and can be sorted by first half and second half stats. A great tool for bettors who prefer live betting.
In the ‘Lineups’ tab, you can view the teams’ lineups, which are published about an hour before kickoff for top leagues. In the ‘Text’ tab, there’s a text commentary, though it’s often dry and automatically translated.
Player Statistics
We’ll show player stats using the example of the first goal scorer in the Borussia match, Hoffman. You can access this by clicking his name in the match overview or searching for the player.
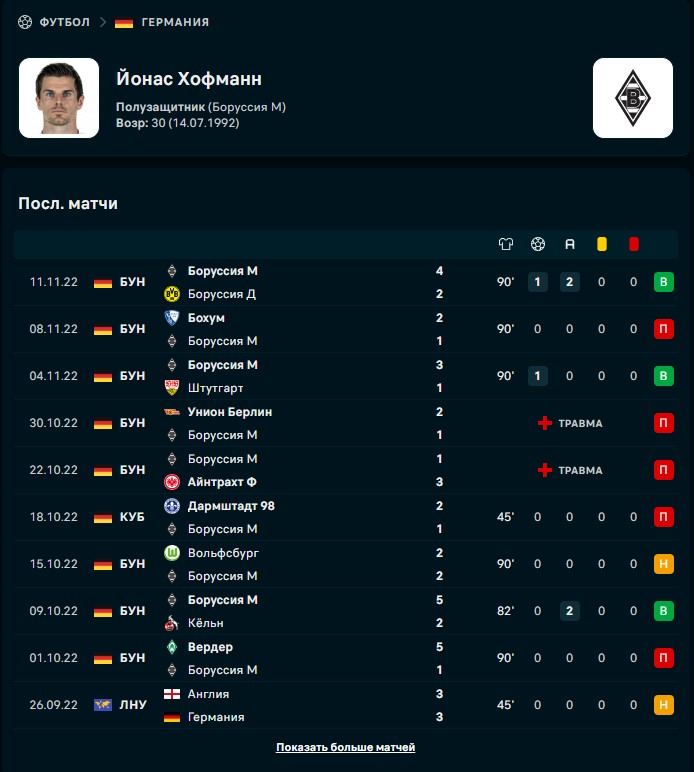
Here, we see the player’s position, age, and performance stats: minutes played, goals, assists, yellow and red cards. More than enough detail.
Conclusion
This is an excellent statistical resource used by most bettors. It doesn’t cover every aspect — for example, it lacks data on how often a team is caught offside, how many warnings a specific referee issues, or expected goals (xG). But it provides the essential foundation for most bettors. For deeper stats, you’ll need to look elsewhere.